If your client's site setup is complicated and you don't have time to replicate it in your local machine, your choice is to debug it directly. This article will show steps on how to debug a website's PHP codes remotely in a server with firewall specifically hosted in Linode server running Centos 7 64-bit Linux distribution, PHP-FPM (FastCGI Process Manager) and PHP 7.0 (the server is running multiple PHP versions).
Steps (remote server):
-
Install Xdebug in your server:
scl enable rh-php70 bash
pecl install Xdebug
Edit:
vi /etc/opt/rh/rh-php70/php.d/15-xdebug.iniHave the following as its content to enable Xdebug:
; Enable xdebug extension module zend_extension=xdebug.so -
Xdebug will need a port (usually its port 9000). To make sure the port that we will use for Xdebug is available, lets check which ports are in use:
netstat -lntu... or:
ss -lntuIt will display something like this:
Active Internet connections (only servers)
Proto Recv-Q Send-Q Local Address           Foreign Address         State
tcp        0      0 0.0.0.0:22              0.0.0.0:*               LISTEN
tcp        0      0 127.0.0.1:9000          0.0.0.0:*               LISTEN
tcp        0      0 127.0.0.1:80            0.0.0.0:*               LISTEN
Since port 9000 is already used (by PHP-FPM pool), we will use port 9001 for our Xdebug.
-
Edit a pool you wish Xdebug will run:
vi /etc/opt/rh/rh-php70/php-fpm.d/www.confAppend the following:
; XDebug php_value[xdebug.default_enable] = 1 php_value[xdebug.remote_enable] = 1 php_value[xdebug.remote_port] = 9001 php_value[xdebug.idekey] = WEBFOOBAR php_value[xdebug.max_nesting_level] = 256 php_value[xdebug.remote_host] = 127.0.0.1 php_value[xdebug.remote_log] = /var/opt/rh/rh-php70/log/php-fpm/xdebug.log -
Restart the PHP-FPM service:
systemctl restart rh-php70-php-fpmXdebug information should show in your phpinfo():
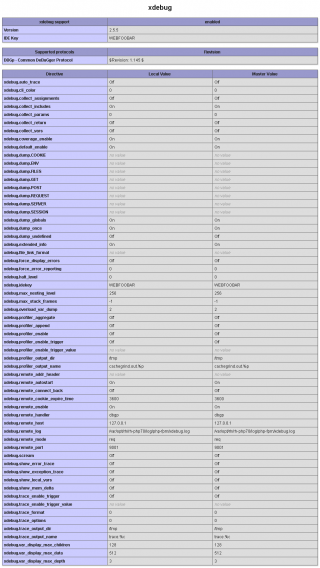
-
Make sure that Allow TCP forwarding is enabled in your SSH server settings:
vi /etc/ssh/sshd_configLook for:
AllowTcpForwarding yesRestart the SSH service:
systemctl restart sshd

Steps (local machine):
-
Our site's remote server is protected with firewall and it will prevent the Xdebug from connecting to PhpStorm. We will use SSH tunnel port forwarding as a solution. If your local machine has ssh client command line program, execute the following command:
ssh -i ~/.ssh/id_rsa -R 9001:127.0.0.1:9000 [email protected]Where:
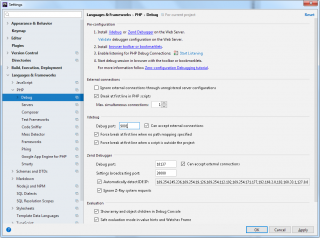
-i ~/.ssh/id_rsainclude this ssh option if your server SSH is using Key-Based Authentication-R 9001:127.0.0.1:9000opens up port 9001 as we set the server's Xdebug'sxdebug.remote_portto 9001 earlier then forwarded to 127.0.0.1:9000 where PhpStorm is listening[email protected]are the username and hostname of the serverNote: If you want to change the Xdebug listening port of PhpStorm, click "File" > "Settings..." > "Languages & Frameworks" > "PHP" > "Debug". Under "Xdebug" change the "Debug port" to your desired port.
-
If you are using Windows, download PuTTY here to use as SSH client and this client has setting for SSH tunnel port forwarding also.
Configure first your normal session and go to "Connection" > "SSH" > "Tunnels" of the PuTTY settings and populate the "Source port" with
9001and "Destination" with127.0.0.1:9000; select "Remote" option; click "Add" button: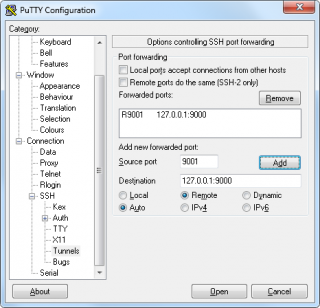
And don't forget to go back to the "Session" tab and click "Save" button to save this settings. Finally, click "Open" button to start your SSH session to your site's server.
-
Now, to test if the SSH tunnel port forwarding works, run the following command inside your SSH prompt:
netstat -a -n | grep 9001You should see something like this as response:
tcp 0 0 127.0.0.1:9001 0.0.0.0:* LISTEN -
Follow the steps in this article to create a PhpStorm project from a remote host.
-
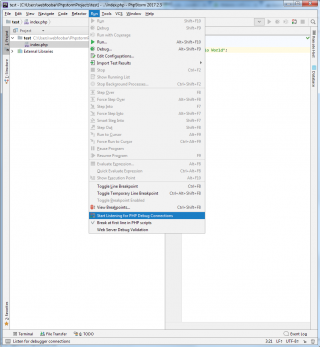
In your PhpStorm, click "Run" > "Break at first line in PHP scripts". This is optional, it is just to ensure that the PhpStorm will trigger when we started to debug our site. To start the PhpStorm listening to Xdebug, click "Run" > "Start Listening for PHP Debug Connections":
-
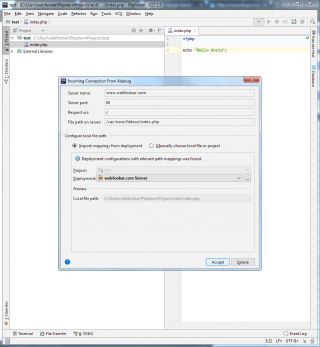
Open your favorite web browser and visit your site. This should pop a window at PhpStorm that there's incoming connection from Xdebug, just click the "Accept" button:
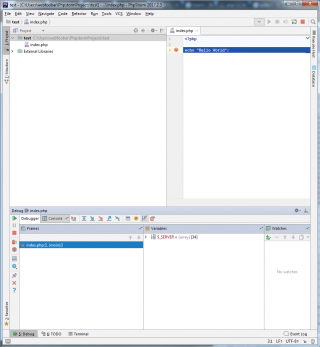
Your PhpStorm will trigger to stop and highlight at the first line in your site's PHP script:


Comments
Codelobster IDE
xDebug and Codelobster IDE work best for me
Xdebug
Hi, I think your article about xdebug is the best on internet. Through it I could understand better how thinks works. However, I continue without debug because phpstorm does not connect even everything configured. Could you help me ?